Central Grafana monitoring multiple distributed EKS (Part 1)
Apr 29, 29290··
1 min read
ntnguyencse
 Image credit: ntnguyencse
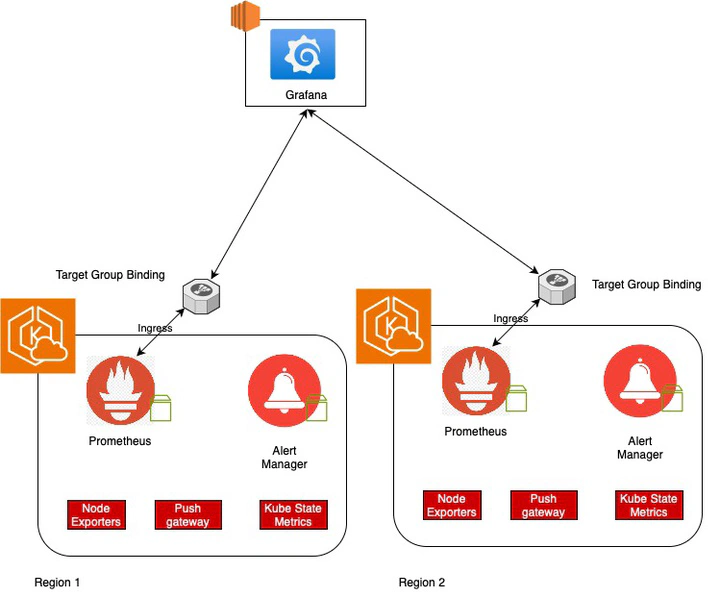
Welcome 👋. I’d like to present an architecture for monitoring distributed EKS clusters. This approach also applys to another Kubernetes cluster types. No vendor lock-in.
Overview
- EKS is convinience for provision and run workloads at ease.
- Monitoring EKS solution providing by AWS is costly and tightly bound to Cloud Watch
- Providing an opensource monitoring, easy allow to share with dev teams, sales and marketing teams.
Architecture
There are many clusters that have installed Prometheus and Alert Manager. Grafana is used centralized visualization multiple data sources.
